Written by: Angelo M. Gandia, MBA
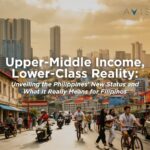
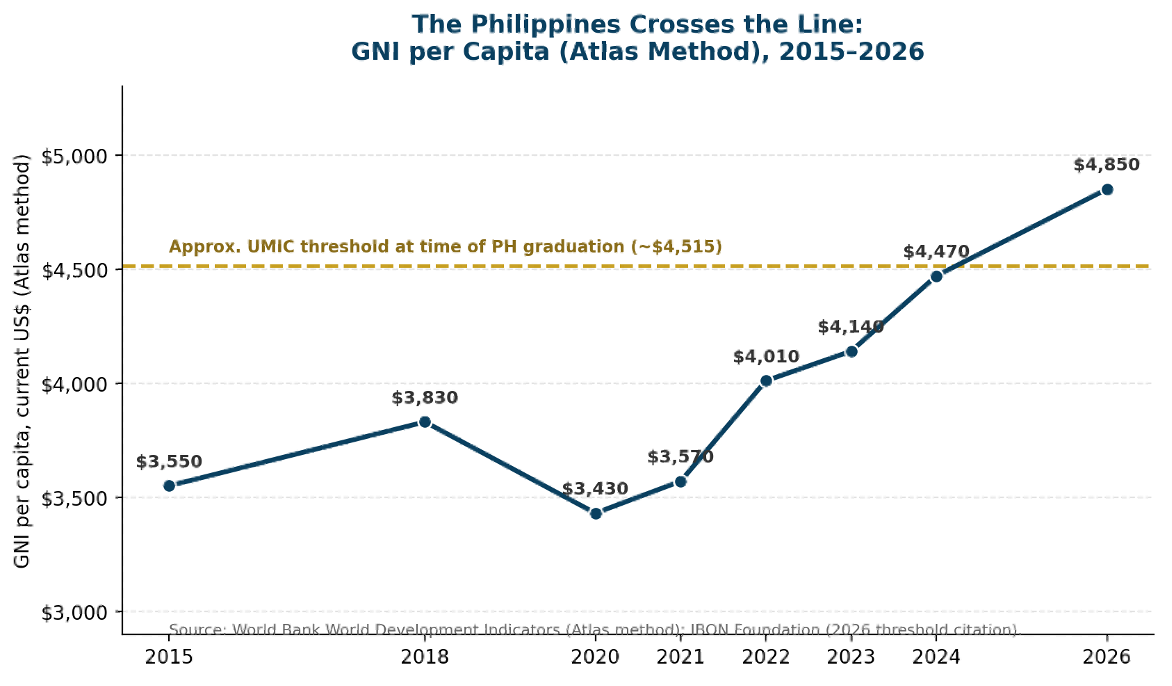
On 1 July 2026, the World Bank reclassified the Philippines as an upper-middle-income country (UMIC), crossing a gross national income (GNI) per capita threshold of roughly US$4,850 under the Atlas method. The World Bank framed the milestone as “a recognition of decades of reform efforts underpinning sustained growth, job creation, poverty reduction and resilience,” and explicitly cast it as a launchpad rather than an arrival.
Yet the same week the classification took effect, civil-society economists were making the opposite argument with equal force: that the label describes the country’s aggregate income, not the income of the typical Filipino family, and that roughly eight to nine in ten Filipino households remain poor, low-income, or lower-middle-income by domestic standards. Both claims are true, and reconciling them is the purpose of this article.
This article examines what UMIC status actually measures, what it changes materially for the Philippines (particularly its access to concessional development financing), and what it leaves untouched — poverty depth, job quality, inflation exposure, deindustrialization, and the urban and housing deficits that shape whether ordinary Filipinos experience “growth” in their daily lives. It closes with a policy and investment agenda, including the role of well-structured public–private partnerships (PPPs) and inclusive urban planning, for making the status felt at the bottom of the pyramid rather than only at the top of the ledger.
“The classification says little about the quality of growth, the distribution of income, the strength of the productive economy, or the living conditions of most Filipinos.” — IBON Foundation, July 2026
What “Upper-Middle Income” Actually Means
The World Bank’s income classifications — low, lower-middle, upper-middle, and high income — were created in the late 1980s primarily as an operational tool to determine a country’s eligibility for concessional loans and other development finance, not as a certification of development achievement. The threshold is a single number: GNI per capita, converted to US dollars using the Atlas method (which smooths exchange-rate and inflation fluctuations over a three-year average) and divided by the country’s midyear population.
At the July 2026 threshold, the Philippines’ roughly US$4,850 GNI per capita implies, taken literally, that the average Filipino family of 4.1 members earns the peso equivalent of about ₱1.2 million a year — close to ₱100,000 a month. In reality, independent estimates using the Philippine Institute for Development Studies’ (PIDS) income-class framework and IBON Foundation’s family-income brackets both find that only the richest 3–4 percent of Filipino families earn at that level. GNI per capita is a mean, and the Philippines’ income distribution is heavily right-skewed: a relatively small number of high-income households pull the national average well above what a typical household actually earns.
This is not a Philippine-specific quirk — it is true of every country’s headline income statistic — but it matters enormously for how the milestone should be communicated and acted upon. Conflating a lending-eligibility threshold with a living-standards benchmark risks precisely the kind of premature triumphalism that erodes public trust in official statistics and in the institutions that report them.
The Milestone: What the Philippines Got Right
None of the above should obscure genuine, hard-won progress. Since 2010, the Philippine economy has more than doubled in size. Millions of jobs have been created, unemployment and underemployment have trended down over the medium term, and poverty reduction resumed after the disruption of the COVID-19 pandemic. Income growth among poorer households has, on average, outpaced that of richer households in recent years, modestly narrowing inequality.
These gains reflect a combination of macroeconomic stability, sustained public investment, a dynamic private sector, strong overseas Filipino worker (OFW) remittances, an expanding business-process outsourcing and services-export base, and Filipino entrepreneurship — reinforced by reforms that opened previously restricted sectors to foreign investment, improved digital and physical connectivity, and expanded social protection programs such as conditional cash transfers.
The Philippine Development Plan (PDP) 2023–2028 anchors these gains in an explicit poverty-reduction target: bringing national poverty incidence down to single digits (9 percent) by 2028. Progress against that target has been real — poverty incidence fell from 18.1 percent in 2021 to 15.5 percent in 2023, already ahead of the PDP’s own interim target range of 16–16.4 percent for that year. The open question, and the subject of the next section, is whether that trajectory is fast and broad enough to make UMIC status feel like progress rather than a statistical artifact.
The Gap at the Bottom of the Pyramid
Poverty: Progress, Interrupted and Resumed
The Philippine Statistics Authority’s (PSA) official poverty series tells a story of three decades of decline, a sharp COVID-era reversal, and a partial recovery. National poverty incidence among the population stood at 23.3 percent in 2015, fell to 16.7 percent in 2018, then rose to 18.1 percent in 2021 as the pandemic destroyed jobs and incomes — the first interruption in more than 30 years of continuous poverty reduction. By 2023, it had fallen back to 15.5 percent, equivalent to 17.54 million Filipinos, with the PSA’s National Statistician noting explicitly that “if food inflation had been lower, the reduction in poverty could be much, much bigger.”
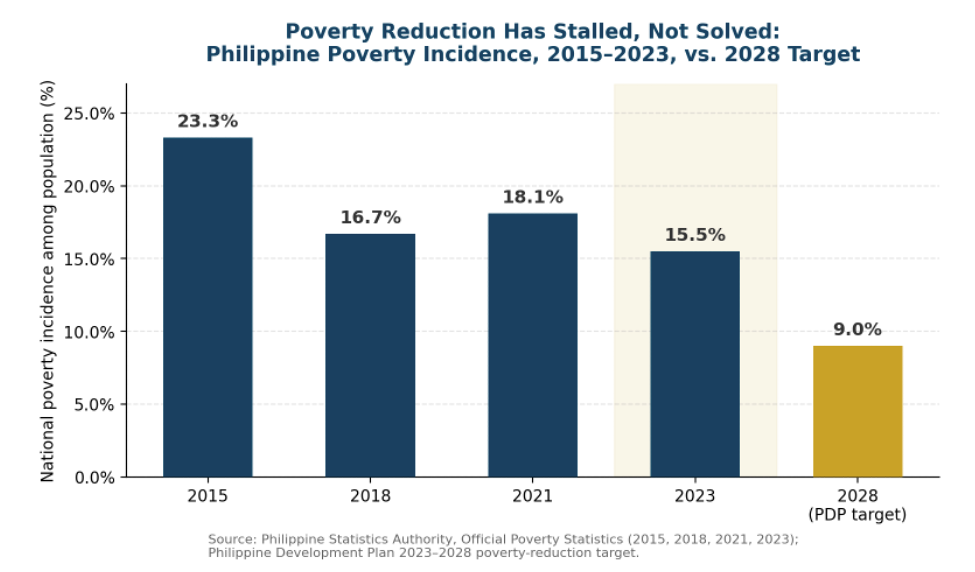
Figure 1. Philippine poverty incidence, 2015–2023, against the Philippine Development Plan 2023–2028 target of 9% by 2028. Source: PSA Official Poverty Statistics; PDP 2023–2028.
The 2028 target of single-digit poverty is achievable only if the average annual pace of reduction seen between 2021 and 2023 (roughly 1.3 percentage points per year) is sustained or accelerated for five more years — through an inflation environment, energy-price cycle, and global trade backdrop that are all considerably less favorable in 2026 than they were in 2023.
Income Classes: A Pyramid, Not a Middle-Class Society
UMIC status is sometimes read, incorrectly, as implying that the Philippines has become a predominantly middle-class society. Independent income-class analyses suggest otherwise. IBON Foundation estimates that roughly 77 percent of Filipino families (84 percent of the population) fall into the poor, low-income, or lower-middle-income brackets, defined as monthly family incomes of ₱36,000 or less; only about 3 percent of families (838,000 households, 1.9 percent of the population) qualify as upper middle-class, with incomes between ₱64,000 and ₱128,000 a month. A separate PIDS study using a different methodology arrives at a similar structural picture: 82 percent of households in the poor-to-lower-middle-income brackets, versus roughly 4 percent classified as upper middle-income.
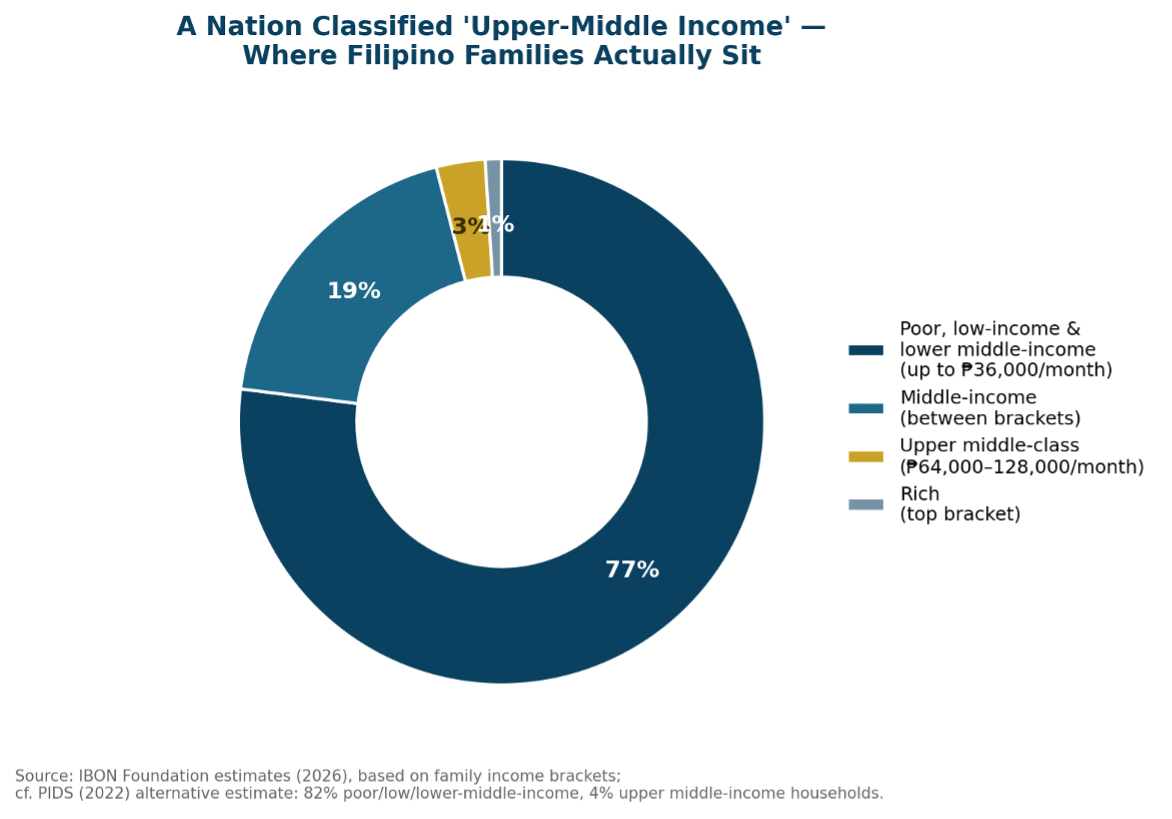
Figure 2. Estimated distribution of Filipino families by income class, illustrating the concentration of households in the poor-to-lower-middle-income brackets even after UMIC reclassification. Source: IBON Foundation (2026) estimates; cf. PIDS (2022) alternative estimate.
The two estimates differ in method and precision, but they converge on the same structural conclusion: eight to nine in every ten Filipino families sit below the income level implied by the national UMIC average. This is the empirical core of the public’s skepticism, and it is a legitimate statistical observation rather than mere sentiment.
Why It Doesn’t Feel That Way: Inflation, Jobs, and the Cost of Living
The GNI Climb Versus the Peso in People’s Pockets
The Philippines’ GNI per capita rose from roughly US$3,550 in 2015 to about US$4,850 by mid-2026 — a trajectory driven substantially by nominal GDP growth, peso movements, and remittance and services-export inflows, layered on top of population growth of roughly 1.3–1.5 percent annually. That aggregate climb has coincided with a far bumpier ride in the cost of living for the households at the base of the income pyramid.
Inflation Has Repeatedly Outpaced the Central Bank’s Comfort Zone
Headline inflation eased to a manageable 2.4–2.5 percent in 2019–2020, then surged to 5.8 percent in 2022 and 6.0 percent in 2023 — both years well above the Bangko Sentral ng Pilipinas’ (BSP) 2–4 percent target band — before easing to 3.2 percent in 2024 and 1.7 percent in 2025. By the first half of 2026, inflation had climbed back to a 4.8 percent average, with a spike to 7.2 percent in April 2026 driven by transport and fuel costs linked to geopolitical shocks.
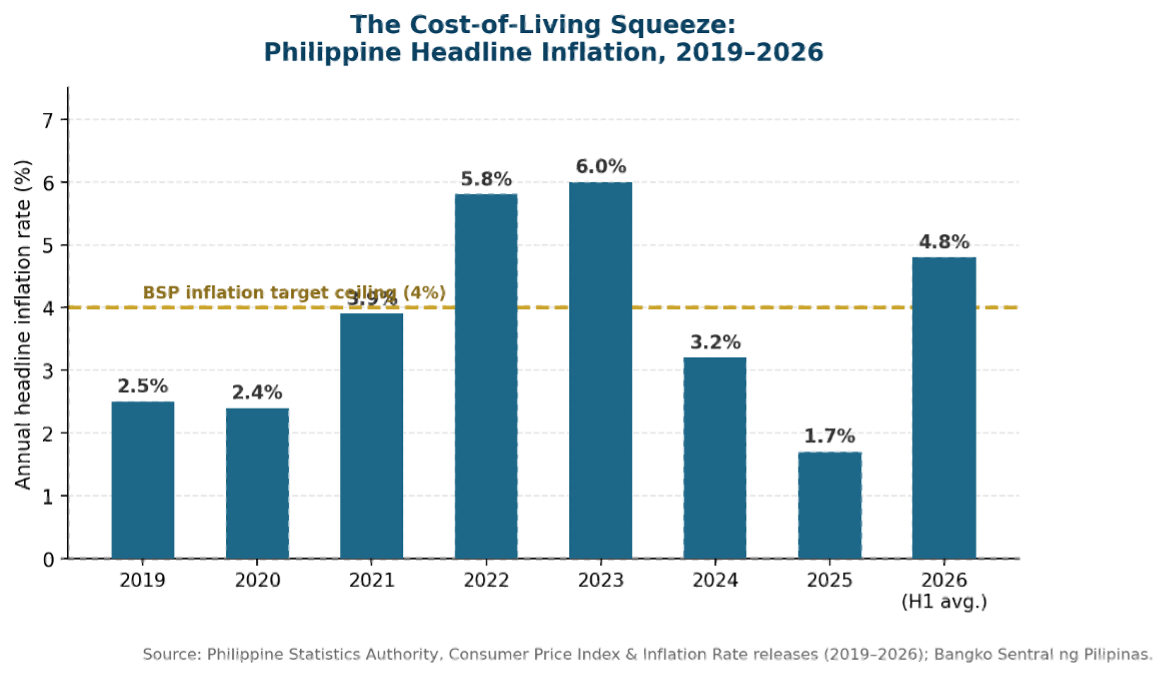
Figure 4. Philippine headline inflation, 2019–2026, against the BSP’s 4% target ceiling. Source: PSA Consumer Price Index and Inflation Rate releases; BSP.
For households near the poverty line, food and transport — the two categories most exposed to global commodity and fuel-price shocks — make up the largest share of the household budget. This is precisely why PSA’s National Statistician attributed a meaningful share of the shortfall against the 2023 poverty target directly to food inflation: aggregate income growth is real, but it is repeatedly eroded by price shocks concentrated in the goods poor households buy most.
Deindustrialization and the Quality of Jobs
A structural concern raised consistently across the sources reviewed for this article is the shrinking productive base of the economy. Manufacturing’s share of GDP has fallen from a peak of nearly 28 percent in 1979 to roughly 17.4 percent in 2025 — its smallest share in over seven decades — while agriculture’s share has fallen to its smallest share in the country’s history, at roughly 7.9 percent of GDP. A services- and remittance-led growth model has generated jobs and export earnings, but critics argue it has not generated enough of the higher-productivity, higher-wage manufacturing and agro-industrial jobs that historically underpinned other countries’ transitions from upper-middle to high-income status — South Korea and, more recently, Vietnam and Thailand among them.
The Financing Trap: What UMIC Status Changes on the Balance Sheet
Beyond its symbolic weight, UMIC reclassification has a concrete fiscal consequence: it narrows the Philippines’ access to concessional (low-interest, long-tenor) financing from the World Bank, the Asian Development Bank (ADB), and other international financial institutions, pushing the country toward more expensive, market-based borrowing at exactly the moment it must still finance large infrastructure, health, education, and climate-resilience gaps.
Since 1957, the Philippines has borrowed an estimated US$35 billion through World Bank-funded projects alone, alongside decades of ADB concessional and near-concessional lending. Losing preferential access to that financing before the underlying development gaps — poverty, weak agriculture, a shrinking manufacturing base, and uneven infrastructure — have been closed creates a real risk: a widening financing gap precisely when debt-servicing costs are set to rise. This is arguably the single most consequential, and least publicly discussed, implication of the UMIC transition, and it is where fiscal policy, tax administration, and capital-markets development intersect directly with the poverty and jobs agenda described above.
The policy response implied by this dynamic is twofold: first, front-load the use of the remaining concessional-financing window on the highest-return investments — health, education, public transport, renewable energy, agricultural modernization, and industrial upgrading; and second, strengthen domestic revenue mobilization through more progressive taxation, reducing long-run dependence on increasingly expensive commercial and market-based debt.
Infrastructure, Urban Planning, and Real Estate: The “Unseen” Dimension
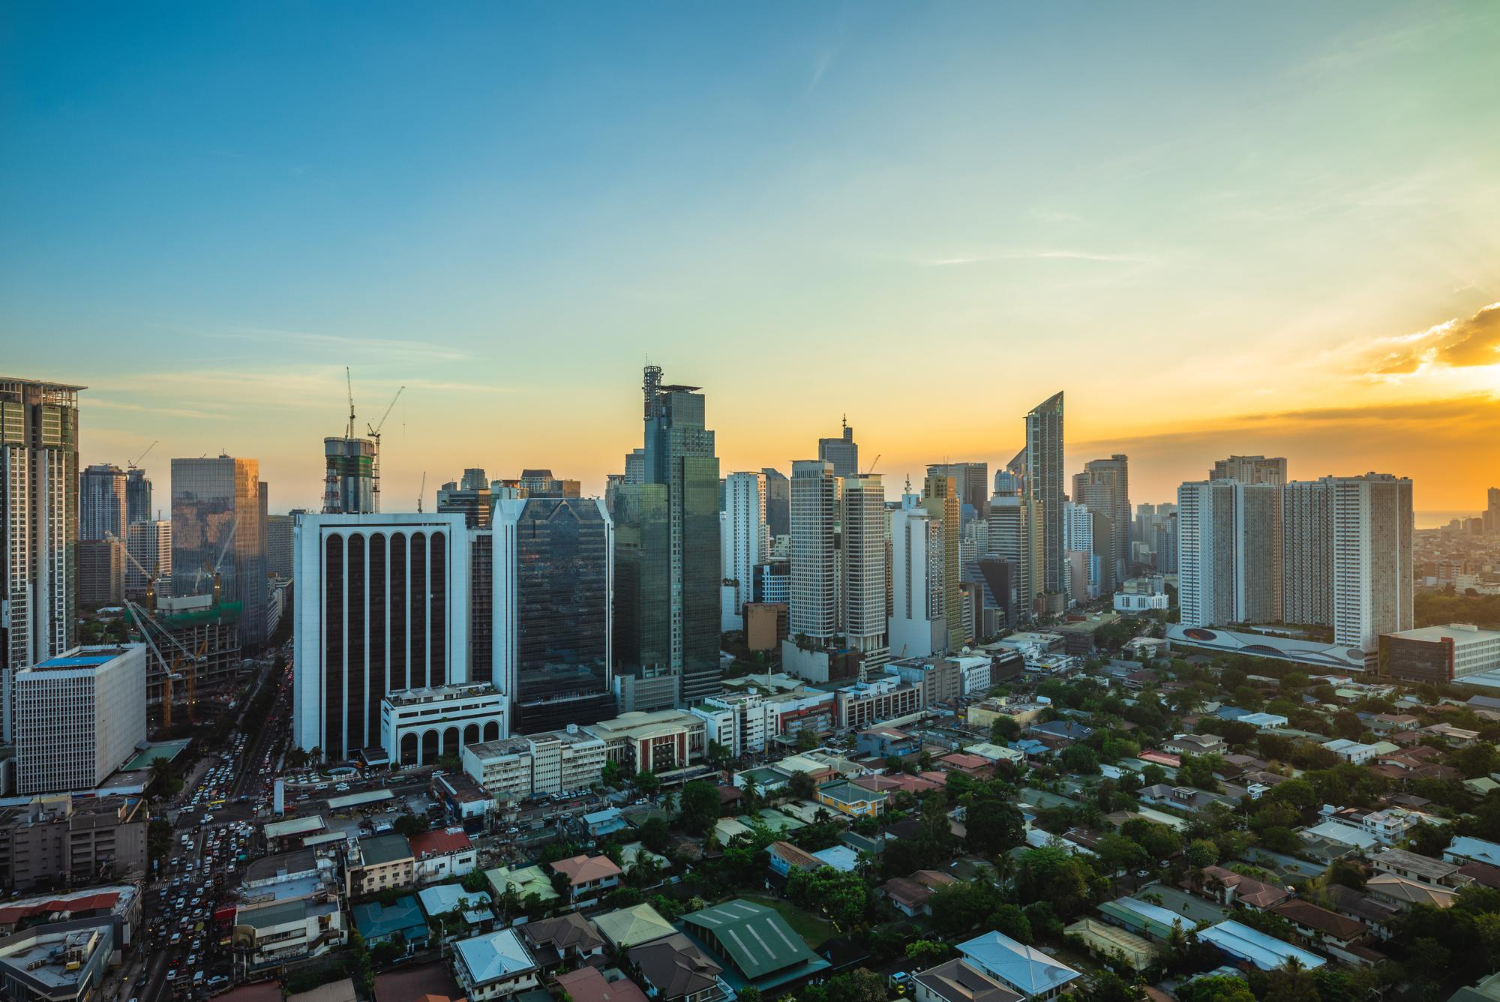
For an advisory firm operating at the intersection of transaction advisory, business development, and PPP structuring, this is where the UMIC narrative becomes operationally material rather than merely academic. Upper-middle-income status is expected to reinforce investor confidence and support continued capital flows into infrastructure, township developments, and urban real estate. The World Bank itself frames the transition as an opportunity to expand “better transport, logistics and digital connectivity” and to build “a more sophisticated economy that creates better jobs, raises incomes, expands opportunity across regions.”
But capital inflows and physical development are not, by themselves, equivalent to inclusive urban development. The same structural pattern visible in the income data — concentrated gains at the top, thin gains at the base — shows up spatially as well. Poverty incidence remains sharply uneven across the country: PSA’s 2023 small-area estimates show 881 of the Philippines’ 1,611 cities and municipalities with poverty incidence at or below 20 percent, while pockets in the Bangsamoro Autonomous Region, the Zamboanga Peninsula, and parts of the Cordillera and Visayas still register poverty incidence above 60 percent — in the single worst case, nearly seven in ten residents. Rural poverty incidence (22.1 percent in 2023) remains more than double urban poverty incidence (10.3 percent).
This unevenness is the strongest argument for treating PPP-led infrastructure, housing, and township development not as a side benefit of UMIC status but as one of its central delivery mechanisms. Sustainable, well-planned urban centers outside Metro Manila — anchored in affordable and mixed-income housing, resilient public transport, and climate-adaptive design — are how national income growth gets converted into livable, resilient communities for the 84 percent of the population still classified below upper-middle income. Absent that deliberate spatial and social targeting, new capital risks reproducing the existing pattern: high-end, investor-facing development in already-prosperous corridors, with limited spillover to the regions and income classes where the poverty and cost-of-living pressure is most acute.
Lessons from Peers: Converting a Threshold into a Trajectory
Many countries reach upper-middle-income status; comparatively few convert it into high-income status. The World Bank points to three contrasting playbooks. South Korea paired high investment with rapid technology adoption, an aggressive export orientation, and sustained investment in workforce skills. Poland used deeper integration with European markets, competition policy, and institutional discipline to upgrade the productivity of domestic firms. Chile built a dense network of international trade and investment agreements that helped domestic firms connect to global markets and technology transfer.
Notably, IBON Foundation raises a countervailing set of examples — China, Malaysia, and Thailand — which combined openness with far more active state-directed industrial policy: strategic protection of priority sectors, directed public finance, and explicit industrial planning, in contrast to the largely market-led, export-oriented strategy the Philippines has followed since its first World Bank structural adjustment program in 1980. The comparison across these two sets of cases is less about which single model is correct and more about the common thread: sustained, deliberate upgrading of the productive economy — not macro stability alone — is what separates countries that stall at upper-middle income from those that continue on to high-income status.
What the Government Can Do: A Four-Part Agenda
Drawing on the World Bank’s own reform agenda for the Philippines’ next stage of development, and on the structural gaps identified by independent economists, four priorities stand out as the levers most likely to make UMIC status felt at the bottom of the pyramid:
- Sustain and target investment in foundational infrastructure and human capital — transport, logistics, digital connectivity, education, health, and nutrition — with explicit weighting toward the regions and sectors (agriculture, rural areas, indigenous communities) still recording the highest poverty incidence.
- Secure reliable, affordable, and cleaner energy. High energy costs weigh disproportionately on manufacturing competitiveness and on poor households’ budgets; a faster, well-sequenced transition to a diversified, renewable-based energy system would ease both cost-of-living pressure and industrial cost structures simultaneously.
- Strengthen domestic revenue mobilization through more progressive taxation, and use the narrowing window of concessional financing deliberately — prioritizing health, education, public transport, agricultural modernization, and industrial upgrading over lower-return spending.
- Deploy inclusive, well-governed public–private partnerships for housing and urban development outside the existing high-growth corridors, paired with transparent, corruption-resistant procurement and delivery — directly addressing the governance concerns that consistently surface in public skepticism toward official growth narratives.
The World Bank’s own framing captures the throughline across all four: “Investors need predictable rules and efficient public services. Citizens need institutions they can trust, that deliver quality services, apply rules fairly and respond quickly to shocks.” Sustaining progress, in other words, is as much a governance and trust challenge as it is a financing or infrastructure one.
Making the Status Felt at the Bottom
The Philippines’ graduation to upper-middle-income status is a genuine, hard-earned milestone — the product of sustained macroeconomic management, an increasingly diversified economy, and decades of incremental reform. It is also, definitionally, a lending classification built on a national income average, not a certification that most Filipino households have crossed into a comparable standard of living. Both statements can be true at once, and treating them as contradictory is what fuels the public backlash visible in the days following the announcement.
The more useful question for policymakers, investors, and advisory practitioners alike is not whether the classification is deserved — by the World Bank’s own methodology, it is — but whether the next chapter of Philippine development converts a national income average into broad-based improvements in poverty, job quality, price stability, and the built environment where Filipinos actually live. On the current trajectory, the 2028 single-digit poverty target, the still-shrinking manufacturing base, the recurring inflation shocks, and the still-unresolved urban and housing gaps outside Metro Manila all suggest the answer is not yet settled.
UMIC status is a launchpad, not a landing. Whether the Philippines’ next chapter is felt at the bottom of the pyramid — not just at the top of the GNI ledger — will be decided by the reforms that follow, not the threshold that was crossed.
________________________________________
References
Africa, S. (2026, July 5). PH is upper middle-income, Filipinos aren’t. IBON Foundation. https://www.ibon.org/ph-is-upper-middle-income-filipinos-arent/
Bangko Sentral ng Pilipinas. (2026). Table 34: Inflation rates. https://www.bsp.gov.ph/Statistics/Prices/tab34_inf_2018.aspx
BusinessMirror. (2026, July 14). An upper-middle-income nation, but how? https://businessmirror.com.ph/2026/07/14/an-upper-middle-income-nation-but-how/
BusinessWorld. (2026, July 2). Philippines now an upper-middle-income country, World Bank says. https://bworldonline.com/top-stories/2026/07/02/760634/philippines-now-an-upper-middle-income-country-world-bank-says/
Center for Integrative and Development Studies, University of the Philippines. (2023). Steering the economy amidst global uncertainties and new developments. https://cids.up.edu.ph/
Department of Economy, Planning, and Development (formerly NEDA). (2023). Philippine Development Plan 2023–2028. https://pdp.depdev.gov.ph/
GMA News Online. (2026). Philippines upper-middle-income status. https://www.gmanetwork.com/news/money/economy/993523/philippines-upper-middle-income-status/story/
Inquirer.net. (2026). PH income upgrade not proof of broad-based progress — groups. https://newsinfo.inquirer.net/2261150/ph-income-upgrade-not-proof-of-broad-based-progress-groups
ISEAS – Yusof Ishak Institute. (2024). ISEAS Perspective 2024/102. https://www.iseas.edu.sg/
ISEAS – Yusof Ishak Institute. (2026). ISEAS Perspective 2026/31. https://www.iseas.edu.sg/
Manila Bulletin. (2026, July 14). At last, upper-middle income. https://mb.com.ph/2026/07/14/at-last-upper-middle-income
Mustafaoğlu, Z. (2026, July 7). Upper-middle income: A launchpad for the Philippines’ future. World Bank. https://www.worldbank.org/en/news/opinion/2026/07/07/upper-middle-income-a-launchpad-for-the-philippines-future
OECD. (2026). OECD Economic Surveys: Philippines 2026 — Sustaining growth and stability amid headwinds. https://www.oecd.org/
Philippine News Agency. (2026). Upper-middle income: What’s next for PH? https://www.pna.gov.ph/opinion/pieces/1203-upper-middle-income-whats-next-for-ph
Philippine Institute for Development Studies. (2022). Discussion Paper Series No. 2022. https://pidswebs.pids.gov.ph/
Philippine Statistics Authority. (2024). 2023 Full Year Official Poverty Statistics of the Philippines. https://psa.gov.ph/
Philippine Statistics Authority. (2026). Poverty statistics. https://psa.gov.ph/statistics/poverty
Philippine Statistics Authority. (2026). National accounts. https://psa.gov.ph/statistics/national-accounts
World Bank. (2026). The Philippines: Country overview. https://www.worldbank.org/ext/en/country/philippines