The Global Picture
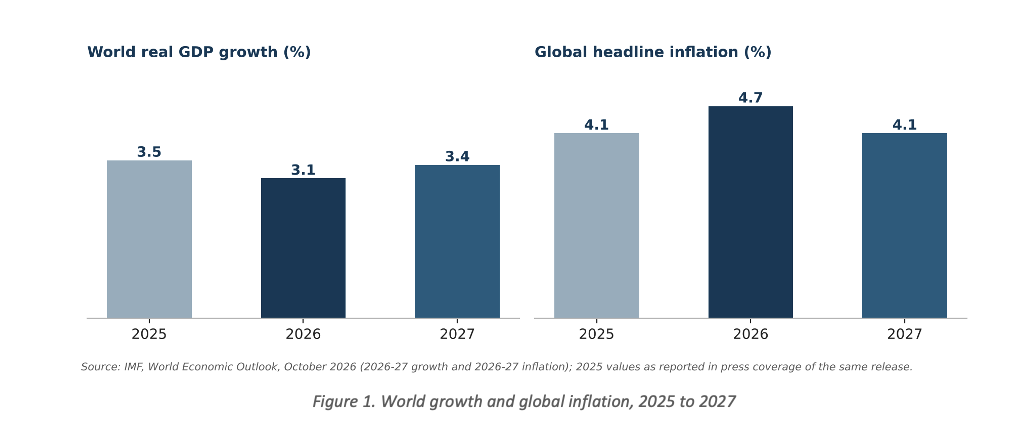
The IMF’s October 2026 World Economic Outlook is titled “Resilience Under Strain, Urgent Choices”, and the title is a fair summary. Global growth is projected at 3.1% in 2026 and 3.4% in 2027, with global headline inflation at 4.7% in 2026, easing to 4.1% in 2027 (Figure 1). The IMF notes that its projections use data available through 1 October 2026, and that energy-importing economies outside the technology value chain face the most difficult outlook.
Three forces drive the picture, as laid out in the IMF’s Asia and Pacific report. The first is the energy shock from the Middle East conflict that broke out in February 2026. Crude has retreated from its April peaks but remains elevated and volatile, and refined products such as diesel and jet fuel have risen much more than crude. The IMF assumes oil supplies return to prewar flows by late 2027. The second is the AI-driven technology boom, which has lifted exports and investment in economies integrated into semiconductor and AI supply chains. The third is continued trade reconfiguration: US tariffs on Asia-Pacific economies remain high, yet the IMF finds little evidence of widespread trade rerouting.
Table 1. Selected global projections, October 2026
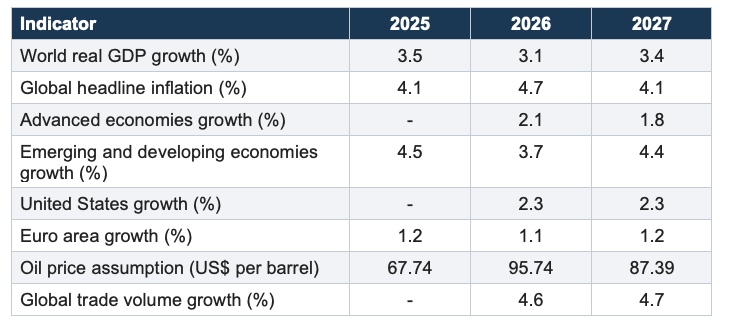
Headline world growth and inflation for 2026-27 are from the IMF’s WEO page; the remaining rows are as reported in press coverage of the release and should be checked against the IMF’s WEO tables. A dash means the figure was not available in the sources used.
The risks the IMF names are a prolonged conflict that keeps energy prices high, a reassessment of AI valuations, renewed trade tensions, and fiscal vulnerabilities, with higher global sovereign yields feeding through to emerging bond markets. The policy advice is consistent across both reports: rebuild fiscal space, preserve monetary and financial stability, and, during cost-of-living shocks, use temporary, targeted income support rather than price-suppressing measures. The WEO estimates that price-suppressing measures can cost 3 to 22 times more fiscal resources than targeted transfers.
Asia and the Pacific
The Asia and Pacific report, published alongside the WEO, finds a region that has so far weathered the oil shock better than expected. Large economies cushioned it by drawing down inventories, diversifying energy sources and substituting inputs, and regional growth in the first half of 2026 outperformed earlier projections. But the gains are uneven across and within economies, with technology-related sectors benefiting more than the rest. Many low-income, agricultural and Pacific island economies have been harder hit by higher fuel, transport, electricity and fertilizer costs.
Asia’s growth is projected to moderate from 5.0% in 2025 to 4.8% in 2026 and 4.4% in 2027, stronger than projected in April 2026. Advanced Asia accelerates to 3.2% in 2026 before slowing to 2.0%, while emerging Asia, still the main growth engine, eases from 5.6% to 5.1% and 4.9% as higher energy prices weigh on consumption and external positions (Figure 2). The large economies tell different stories: India is projected at 7.0%, China slows to 4.5%, Japan stays at 0.7% with fiscal support, and Korea accelerates to 3.3% from 1.1% on the technology boom.
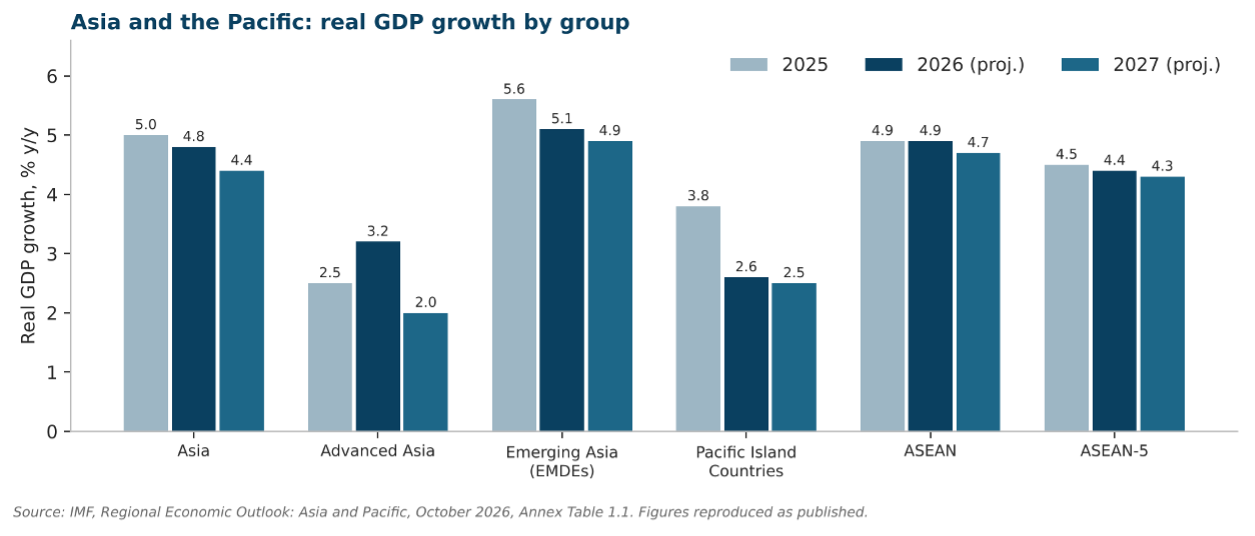
Figure 2. Real GDP growth by group, Asia and the Pacific
The revisions show the divide (Figure 3). The big upgrades went to economies on the technology side of the cycle: Taiwan Province of China (+5.5 points for 2026), Singapore (+1.5), Korea and Hong Kong SAR (+1.4 each) and Vietnam (+1.3). The downgrades went to economies facing higher inflation without that offset. The Philippines is among the largest downgrades in Southeast Asia at -0.7 points, alongside Cambodia (-1.0), Myanmar (-0.9) and Brunei (-0.7), and in sharp contrast with the +0.5 and +0.6 points for Malaysia and Thailand.
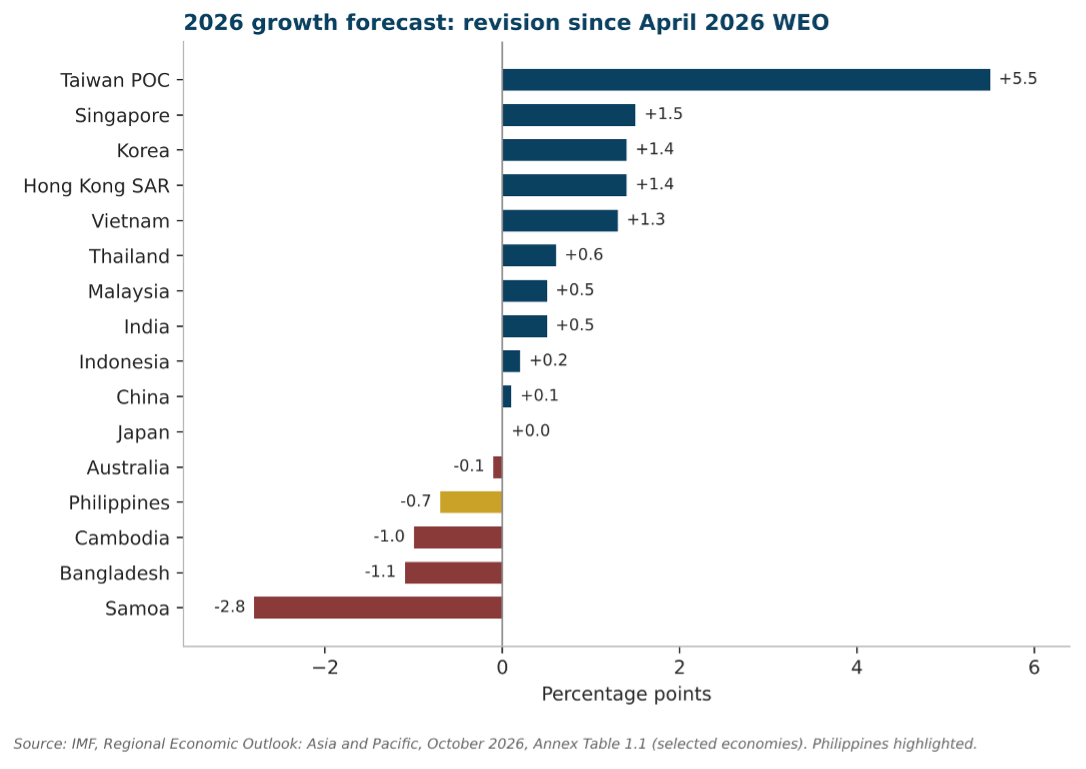
Figure 3. Revision to 2026 growth forecasts versus the April 2026 WEO (selected economies)
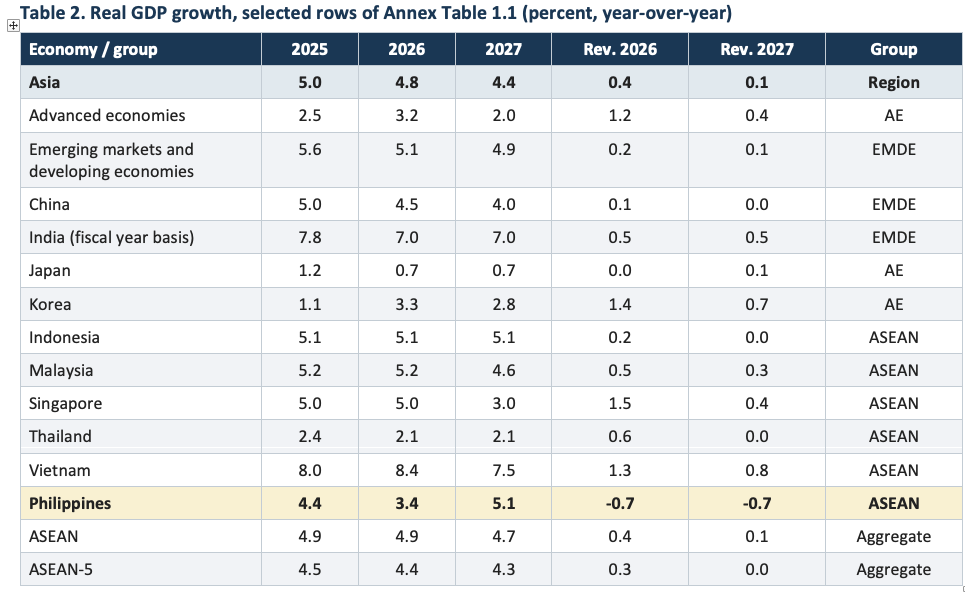
Source: IMF, Regional Economic Outlook: Asia and Pacific, October 2026, Annex Table 1.1. Values are reproduced as published; “Rev.” is the difference from the April 2026 WEO, in percentage points. The full table is in Annex A.
The remaining chapters of the report add context that matters for the Philippines. On labor markets, the IMF finds employer demand in AI-exposed occupations fell by nearly 10% relative to less-exposed jobs since the launch of ChatGPT in November 2022, with the effect levelling off, and notes that in the Philippines nearly 70% of college graduates are in jobs that do not require their degrees. On household consumption, it argues that stronger pensions and social safety nets can reduce precautionary saving and lift private consumption, and it cites the Philippines’ Pantawid Pamilyang Pilipino Program (4Ps) as an existing program whose spending could be repurposed. On services trade, it finds services are about a quarter of regional exports, that restrictions add more than 70% to trade costs for modern services in many economies, and that regional liberalization could raise regional GDP by close to 1% in the long run. That last finding is directly relevant to the ASEAN discussion in Section 4.
The regional risks mirror the global ones, with an added regional twist: a correction in AI-related investment would weigh disproportionately on Asia because of its central role in technology supply chains, and a severe El Niño could disrupt agriculture, fisheries and hydropower and add to food and energy inflation. Both matter to the Philippines, which sits on the wrong side of the divide on energy and agriculture.
The Philippines
What the IMF says
The IMF projects Philippine real GDP growth of 4.4% in 2025, 3.4% in 2026 and 5.1% in 2027. Compared with the April 2026 WEO, both 2026 and 2027 were cut by 0.7 points. Working back from the published revisions, April’s figures would have been roughly 4.1% for 2026 and 5.8% for 2027 (Aviso calculation). Within ASEAN, only Thailand (2.1%), Cambodia (3.0%), Myanmar (2.0%) and Brunei (1.9%) are projected lower for 2026, while 2027’s 5.1% is a rebound that depends on energy prices normalizing (Figure 4).
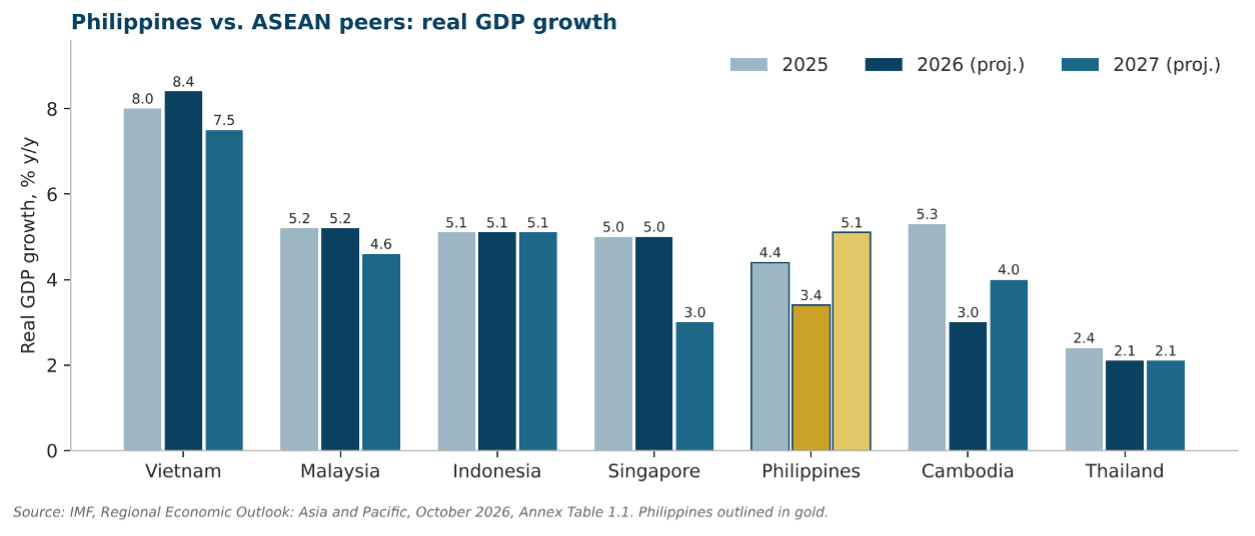
Figure 4. Philippines compared with selected ASEAN economies, real GDP growth
The report’s text on the Philippines is brief but pointed. Inflation has risen faster than historical relationships would predict, with the Philippines cited as the example. The peso was among the currencies under depreciation pressure alongside Indonesia, India and Thailand, although the IMF says pressures partly eased. Among energy-shock responses, the Philippines is named for trade-finance support and for utility vouchers and food cards. The Philippines is also one of the economies for which the IMF’s policy-rate chart (Figure 1.4) tracks monetary policy against an inflation target.
Actual performance versus the outlook
The IMF publishes annual forecasts, so quarterly comparison needs care. Still, the last eight quarters of PSA data tell a clear story (Table 3 and Figure 5): growth ran at 5.3% to 5.5% from late 2024 to mid-2025, dropped to 3.9% in the third quarter of 2025 as public construction fell sharply amid the flood-control corruption scandal, and has slowed in every quarter since, to 2.1% in the third quarter of 2026, the weakest outside the pandemic years. It is the fifth consecutive quarter of deceleration.
Table 3. Philippine real GDP growth, last eight quarters
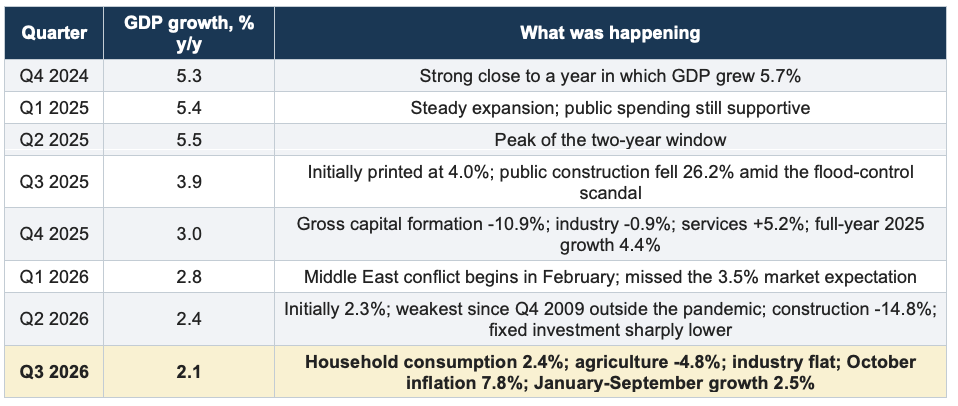
Sources: PSA releases as reported by Philippine and international press (BusinessWorld, GMA News, Daily Tribune, Philippine Canadian Inquirer, Trading Economics and others).
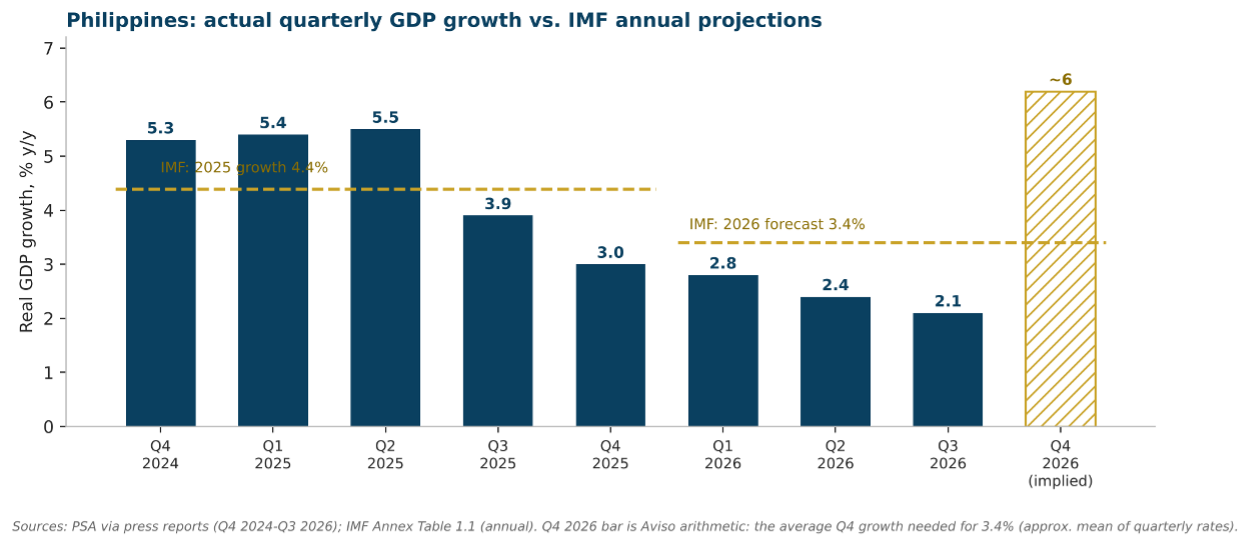
Figure 5. Actual quarterly growth against the IMF’s annual projections
The IMF’s 2025 estimate of 4.4% matches the PSA’s reported full-year result, so for last year the outlook and the actuals agree. The problem is 2026. The IMF’s 3.4% is a figure Philippine data are now struggling to support. The first three quarters averaged about 2.4%, and PSA reports 2.5% for January to September. Because annual growth is approximately the average of the four quarterly rates, hitting 3.4% requires a fourth quarter of roughly 6%, which is shown as the hatched bar in Figure 5. Table 4 shows what different fourth-quarter outcomes would imply.
Table 4. Implied 2026 growth under different fourth-quarter outcomes

Aviso arithmetic using a simple average of reported quarterly rates (2.8%, 2.4% and 2.1% for the first three quarters). PSA computes annual growth from GDP levels, so results are approximate.
Two things make a strong fourth quarter possible but not likely. A low base helps: the fourth quarter of 2025 grew only 3.0%. Government spending also remains supportive, growing 8.3% in the second quarter and 6.8% in the third. Against that, the third-quarter print showed household consumption slowing to 2.4%, public construction still falling 15.1%, and inflation accelerating, with BSP warning that it may rise further. Other forecasters have also been lower: the Asian Development Bank (July 2026 update) projected 3.8% and the World Bank (August 2026) 3.7% for 2026, and the government’s own target was lowered to 3.5% to 4.5%. The IMF’s 3.4% is below all three, yet actual data suggest that even this may prove optimistic. We would treat 2.5% to 3.0% as a more realistic planning range for 2026 until fourth-quarter data are in.
The IMF’s 2027 projection of 5.1% deserves equal scrutiny. It assumes oil supplies normalize by late 2027, and it benefits from a weak 2026 base. Reaching it also needs private investment to recover, which in turn depends on interest rates, confidence in public spending, and the construction pipeline.
Inflation, rates and the peso
Table 5. Philippine inflation and monetary conditions
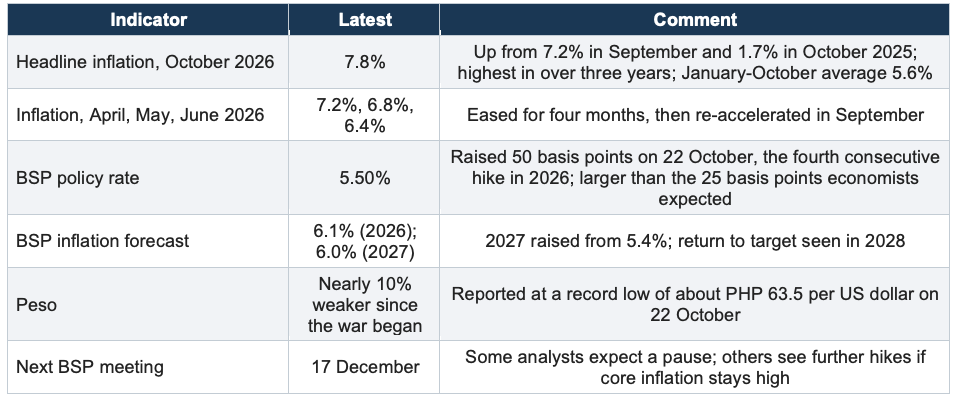
Sources: PSA and BSP, 2026.
This is the clearest point of contact with the IMF’s report. Its policy advice is that central banks should be ready to tighten where oil pass-through is strong and expectations are less anchored, and that fiscal support should be targeted and time-bound. The BSP has followed the first half of that advice. The risk is the familiar one: a supply-driven price shock, met with tighter money, depresses an economy that is already weak. The Philippines imports most of its oil, and food and energy weigh heavily in household budgets, so the shock hits consumption directly.
The major sectors
Table 6. Production and expenditure components of Philippine GDP
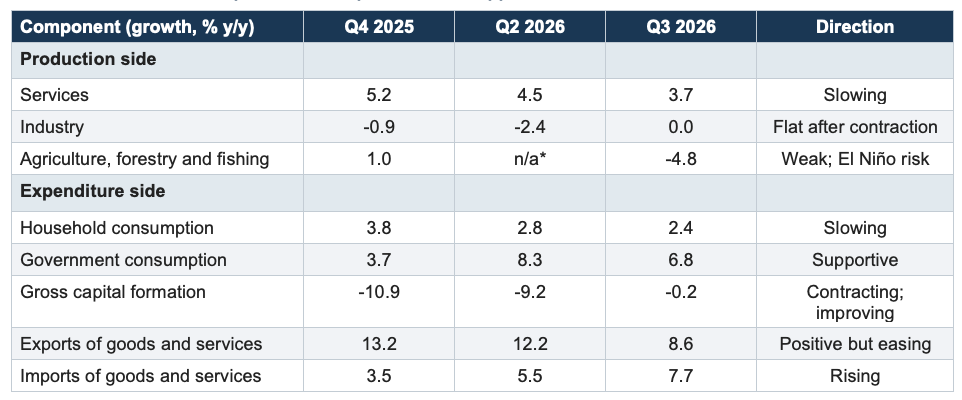
Sources: PSA releases as reported by DZRH, GMA News, Philippine Canadian Inquirer, Trading Economics and DOC/MBC quarterly GDP reports. *Reports of second-quarter agriculture growth range from 0.2% to 2.7%, so no single figure is shown. Quarter-to-quarter comparisons of some components differ between reports; see Data Notes.
Services (about 63% of GDP) still carry the economy but have slowed from 4.5% to 3.7%. Public administration (+9.9% in the third quarter) is doing much of the work, while trade (+3.5%) and finance (+3.5%) have cooled. In the second quarter education (+12.7%) and health (+10.4%) were the fastest-growing activities. Industry has stalled: it contracted 2.4% in the second quarter on a 14.8% fall in construction, and was flat in the third. Agriculture fell 4.8% in the third quarter, with palay and corn output down by more than 17%, ahead of an El Niño risk the IMF and BSP both flag.
The external sector is the bright spot, and it is the technology story in the IMF’s report. Exports grew 8.6% in the third quarter, with electronics exports up 19.4%. This is the Philippine version of the benefit that lifted Korea, Taiwan and Vietnam, although it is much smaller in a Philippine economy that is driven by household consumption (typically about three-quarters of GDP). Investment is the weak spot: gross capital formation has declined for several straight quarters, public construction has fallen for six quarters in a row (-15.1% in the third quarter), and durable equipment investment fell 7.8%. DEPDev Secretary Balisacan attributes the weakness to high food and energy prices, agricultural disruptions, weak investment, and governance concerns and uncertainty that have weighed on confidence.
The IMF’s labor findings add a longer-term point. With nearly 70% of Filipino college graduates in jobs that do not require their degrees, and AI-exposed occupations already seeing weaker hiring elsewhere in Asia, the technology cycle is an opportunity for exports but a risk for the services and business process outsourcing sectors on which much urban office demand rests. That is our inference, not an IMF finding, but it frames how we read the office market below.
Real estate
The property sector sits at the point where the macro hurdles meet. Higher interest rates reduce mortgage affordability and raise the cost of capital for developers; a weaker peso raises the cost of imported construction inputs; falling public construction removes demand from the supply chain; and the slowing of the services economy weakens office demand. The picture is not uniform, however, and the segments are moving in different directions.
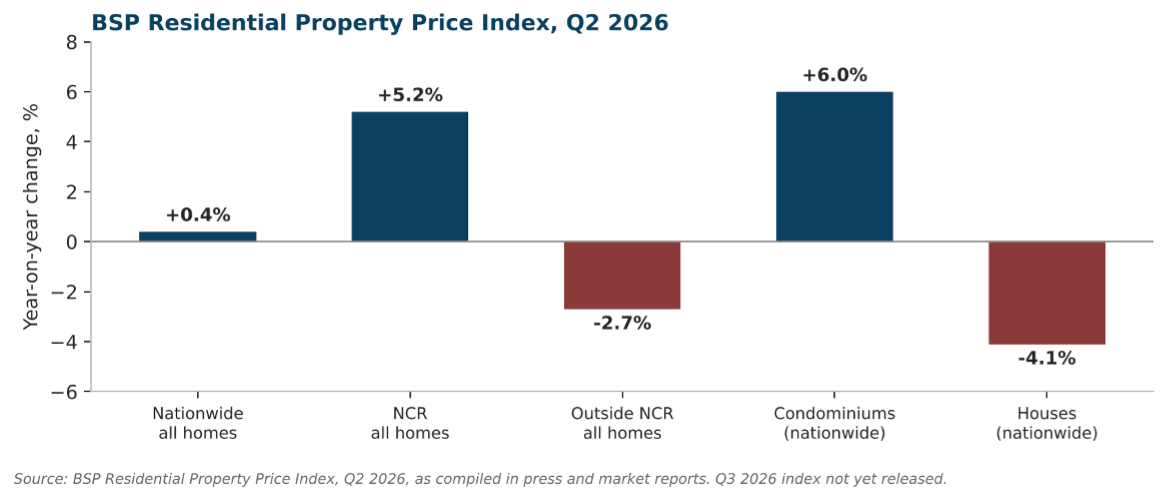
Figure 6. Residential property price changes by type, Q2 2026
Residential
Nationwide home prices rose just 0.4% year-on-year in the second quarter, the slowest on record in the BSP’s index, with condominiums up 6.0% but houses down 4.1%, and prices outside the National Capital Region falling 2.7%. The condominium market in Metro Manila carries a large inventory overhang. Market research puts unsold stock at about 80,000 units, including about 32,000 completed units, down from a record 82,900, which equals about 28 months of supply. Condominium vacancy is about 24.6% and projected to reach a record 25.6% by year-end, with 7,600 units scheduled for completion in the fourth quarter. Launches and take-up of about 3,000 units each so far this year are expected to be the lowest on record, and cancellations reached about 9,000 units from January to September.
Demand is real but selective. Third-quarter condominium sales rose to about 8,454 units, driven by ready-for-occupancy units (+89% year-on-year), while pre-selling sales fell 26%. Roughly two-thirds of first-half take-up was in the PHP 1.8 million to 3.6 million range. Developers are discounting completed units by up to 60%, and Pag-IBIG has introduced promotional fixed rates (4.5% for loans up to PHP 2.5 million and 5.75% for loans up to PHP 10 million, valid to 31 December 2026). The danger is the payment shock that follows. Buyers on in-house developer financing paying PHP 10,000 to 12,000 a month can face PHP 40,000 to 50,000 when bank loans take over, and some cannot qualify, which is where many cancellations arise. That is the same effective-demand problem that separates a need for housing from the ability to buy.
Office
Market research shows Metro Manila office vacancy nearing 20% as supply outpaces demand, after a 24% quarter-on-quarter decline in office transactions in the second quarter. Another market source puts prime office occupancy at 85% and average rents at PHP 895 per square meter per month, the lowest in about ten years. A heavy slate of year-end completions is reported, and tenants are shifting to flexible workspace, where net take-up doubled year-on-year in the first half. Taken with the IMF’s finding on AI and labor, the risk for the office market is a demand problem, not only a supply problem.
Industrial, hospitality and regional
Industrial demand is described as robust, led by semiconductor, food and beverage and consumer goods manufacturers looking for space near ports and expressways, with Central Luzon positioned to benefit. This is the property-market echo of the technology boom the IMF describes. Hospitality is holding, helped by international arrivals and REIT opportunities. Market research also points to opportunity in affordable housing, flexible workspace and development outside Metro Manila.
Table 7. Real estate scorecard, third quarter 2026
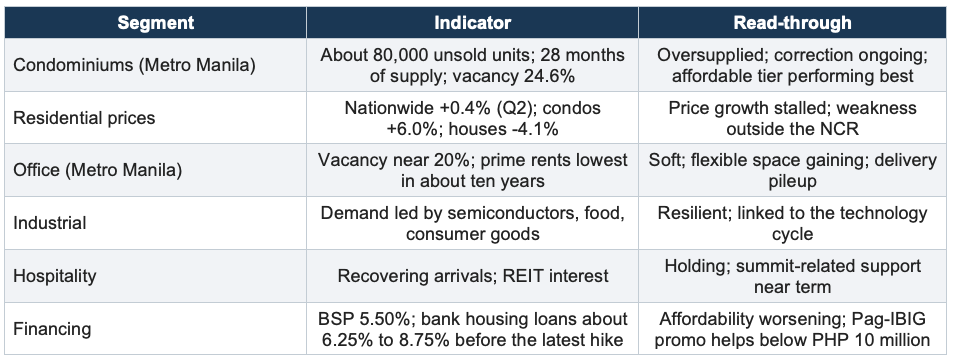
Sources: Industry market research, BSP Residential Property Price Index and Pag-IBIG, as reported by Context.ph, Manila Bulletin, BusinessWorld, SunStar and market compilations, October to November 2026. Figures are as reported; some are market estimates and forecasts. See Data Notes.
What this means for valuation and advisory work
For valuers and feasibility analysts, the practical consequences are straightforward. Rates have moved up, so capitalization and discount rates deserve a fresh look rather than an assumed carry-over. Absorption assumptions for Metro Manila condominiums and offices need to reflect 28 months of supply and near-20% office vacancy, and not the take-up of the post-pandemic recovery. Asking prices and developer discounts are diverging, which makes closed transactions, not list prices, the proper evidence. And the long development lead times we discuss in our market studies mean that projects launched in the optimistic 2024 to 2025 period are now arriving into a weaker market. The view that the slowdown is not a broad collapse and could position the sector for stronger growth in 2027 is plausible, but it depends on the macro recovery that the IMF projects and the Q3 data have yet to show.
The ASEAN Chairship: Opportunity and Limits
What is happening
The Philippines is the 2026 chair of ASEAN, under the theme “Navigating Our Future, Together” and three pillars: peace and security, prosperity corridors, and people empowerment. It took the chair after Myanmar relinquished its turn, and will pass it to Singapore in 2027. The 48th ASEAN Summit was held in Cebu in May. The 49th Summit and related summits are being held at the Philippine International Convention Center in Metro Manila in mid-November. Sources differ on the exact dates, with the ASEAN Secretariat listing ministerial meetings on 14 November and Philippine reports pointing to the summit proper on 16 to 18 November, when Proclamation No. 1447 declares special non-working days in the National Capital Region. The ASEAN Business and Investment Summit takes place on 14 to 15 November under the theme “ASEAN: Creating Our Shared Future in the Age of Intelligence”.
The agenda covers artificial intelligence, the digital economy, energy and food security, semiconductors, trade and inclusive growth, alongside the South China Sea Code of Conduct, which ASEAN and China aim to finish by the end of 2026. The Digital Economy Framework Agreement (DEFA) was expected to be signed in Manila, though that was not confirmed in the sources we reviewed. Over 10,000 foreign delegates are expected, and attendees reported include the US president and the Chinese premier. On the business side, the ASEAN Business Advisory Council is promoting a PHP 35 billion private investment pipeline for an ASEAN Food Security Alliance and a showcase of about 50 micro, small and medium enterprises.
How hosting can help the Philippine economy
The chair holds the pen on the agenda, and there are five realistic channels through which that can support economic performance.
- Investment promotion and deal flow. The ASEAN Business and Investment Summit puts Philippine projects in front of regional and global investors. The PHP 35 billion food-security pipeline is an early example. For a country whose investment has been falling, any credible pipeline helps, provided it converts to registered, financed projects.
- Energy and food security. The shock the IMF describes is an energy and food shock. As chair, the Philippines can push projects that reduce exposure, such as the ASEAN Power Grid, renewable energy cooperation and regional food supply chains. These are medium-term fixes, but they address the specific vulnerability that has set the Philippines apart from its tech-exporting neighbors.
- Services and digital trade. DEFA and the digital and MSME agenda match the IMF’s finding on services trade. Barriers to modern services add over 70% to trade costs in many economies, and only about 14% of modern services exports in the region stay within the region. The Philippines has a strong services and outsourcing base, so rule-making that eases cross-border digital and professional services trade could benefit it more than most. This is our reading of the IMF evidence, not a claim the IMF makes about the Philippines.
- A temporary lift to hospitality and services. The summit season brings thousands of delegates, officials, media and side events to Metro Manila, which supports hotels, restaurants, venues, transport and serviced offices. The effect is real but short-lived, and the special non-working days carry their own cost in lost output.
- Credibility and positioning. Hosting gives the government visibility and a platform for stability, peace and the maritime agenda. For investors weighing governance risk after the flood-control scandal, how the Philippines runs the summit and what it delivers on rules and delivery will be read as a signal.
A reality check
It is important not to overstate the case. The scale of the problem is different from the scale of the event. The Philippine economy is dealing with 7.8% inflation, a 5.50% policy rate, a record-low peso, falling public construction and a growth rate of 2.1%. A three-day summit and a well-run investment forum do not change those fundamentals. Investment pledges at summits are expressions of interest, not capital commitments, and it is common for only a part of what is announced to be registered and built. The things that decide conversion are the ones the IMF and BSP keep returning to: price stability, predictable policy, reliable infrastructure and public spending that is credible and executed.
The chairship therefore works best as an accelerator of reforms that the country needs anyway. The most useful follow-through would be a short list of signed agreements with dates, projects that move from announcement to Board of Investments or Philippine Economic Zone Authority registration, and visible progress on the public investment pipeline we discussed in our earlier article on provincial development planning, where planning and project readiness determine whether money becomes assets.
What to watch
- Signed outcomes. Whether DEFA and other economic instruments are actually signed and what implementation dates they carry.
- The share of announced investments that reach registration or financial close within two to four quarters.
- Real estate effects. Whether the summit period is followed by a rebound in hospitality, serviced office and event-related demand, and whether it lasts beyond November.
- The macro data. Fourth-quarter GDP in January, inflation after the November fuel price increase, and the BSP’s 17 December decision, which will matter more for property than the summit.
The IMF’s October 2026 outlook describes a region that has been resilient because it is plugged into the technology cycle, and a Philippines that is mostly outside it and exposed to the oil shock through prices, the peso and household budgets. The IMF’s 2026 growth projection of 3.4% already reflects a 0.7-point cut, and the third-quarter data point lower still. The 2027 rebound to 5.1% is possible but conditional on energy normalization, monetary easing and a recovery in investment.
For real estate, the cycle has turned, though not uniformly: the affordable segment, industrial and hospitality are holding better than Metro Manila condominiums and offices, and those two are working through a supply overhang at higher borrowing costs. The ASEAN chairship is a useful opening for trade, digital, energy and food cooperation, and a short-term support to services. Its value to the economy will be judged by what is built and financed over the next two to four quarters. For our clients, this is a period for realistic assumptions, closed-transaction evidence and staged commitments, more than for forecasts that assume a quick return to the past.
Aviso Valuation and Advisory Corp. is a real estate consultancy firm that offers valuation and business advisory services that are compliant with international standards such as the International Valuation Standards (IVS) and International Financial Reporting Standards (IFRS). To assure that we only produce high-quality deliverables, as needed, we do tasks beyond the usual appraisal process like verifying pertinent property documents (i.e. land titles, tax declarations, etc.) with the appropriate government agencies for due diligence purposes prior to the acquisition of the properties.
___________________________
References
- International Monetary Fund. Regional Economic Outlook: Asia and Pacific, October 2026. Washington, DC.
- International Monetary Fund. World Economic Outlook, October 2026: Resilience Under Strain, Urgent Choices. 13 October 2026.
- Philippine Statistics Authority. Quarterly national accounts, Q4 2024 to Q3 2026; Consumer Price Index, 2026 (as reported by BusinessWorld, GMA News, Daily Tribune, DZRH, Philippine Canadian Inquirer and Trading Economics).
- Bangko Sentral ng Pilipinas. Monetary policy decision of 22 October 2026; Residential Property Price Index, Q2 2026 (as reported by Interaksyon/Philstar, Central Banking, Rappler and BusinessWorld).
- DOC/MBC. Economy at a Glance: Quarterly GDP reports for Q4 2025 and Q2 2026.
- Industry property market research; Context.ph, Manila Bulletin, SunStar and BusinessWorld property coverage, 2026.
- ASEAN Secretariat. About the ASEAN 2026 Philippine Chairship; Secretary-General to participate in the 49th ASEAN Summit, 2026.
- US-ASEAN Business Council. Philippines sets agenda ahead of ASEAN 2026 chairmanship; Context.ph, THEPHILBIZNEWS and Lifestyle Asia coverage of the 49th ASEAN Summit and ASEAN Business and Investment Summit, 2026.
- Asian Development Bank. Asian Development Outlook, July 2026 update; World Bank, August 2026 Philippines forecasts.